Statistics:
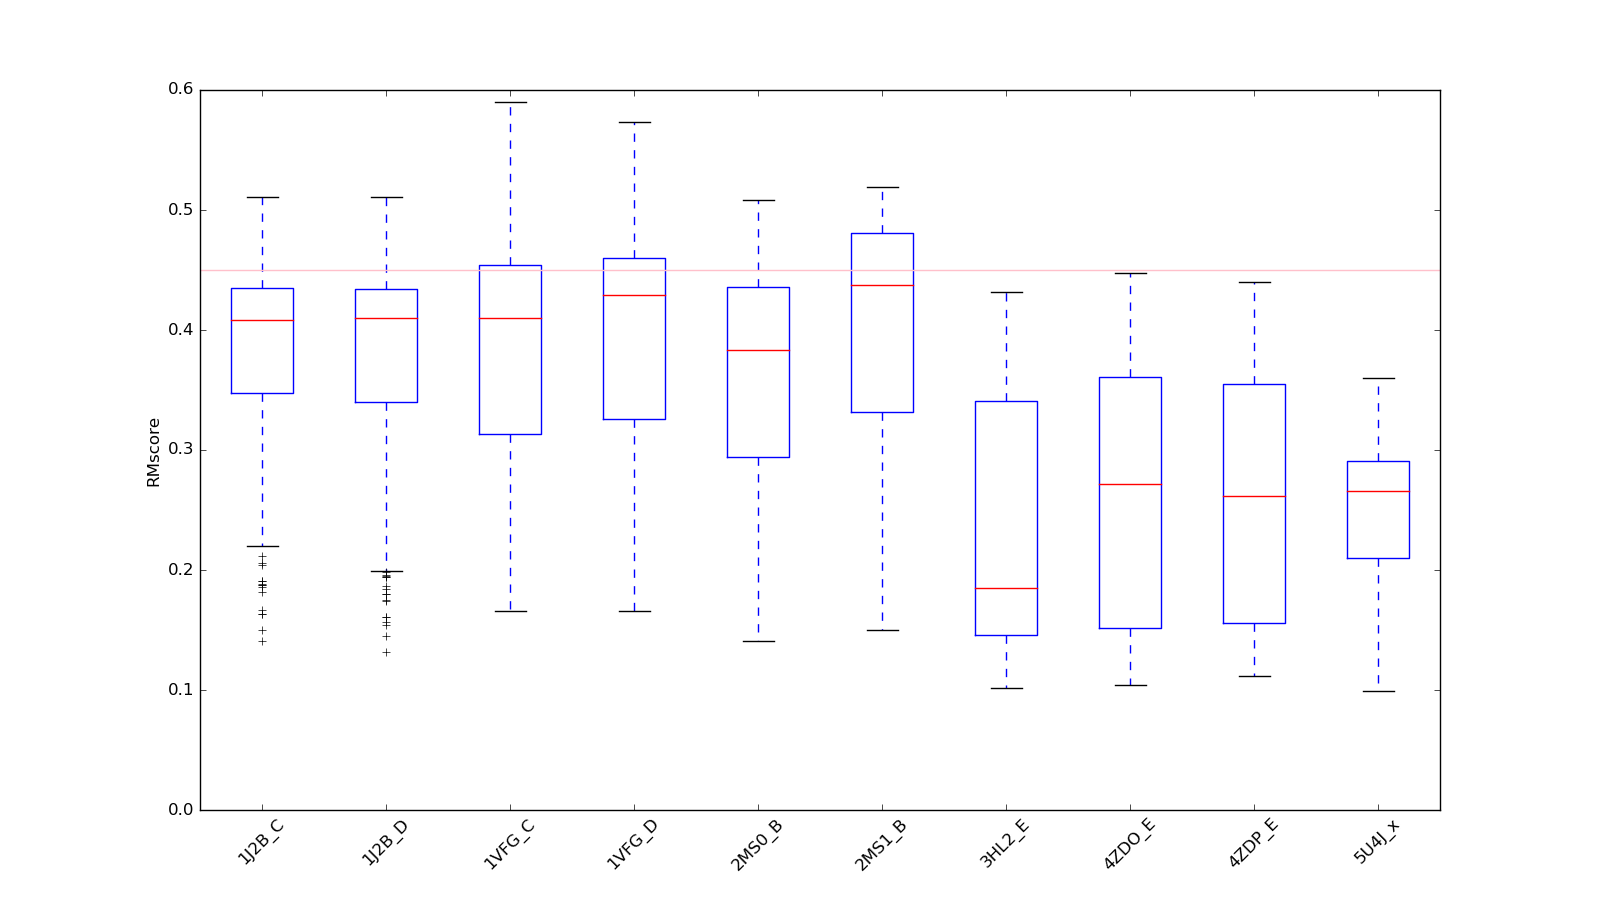
In the first version of RR3DD, the statistic information about RR3DD is shown in Figure 1 to 4. In Figure 1, The clusters with the number of members more than 10 have been shown. Most of these clusters are less than 100 members. The biggest cluster have 1492 RNA structures, most of them are RNA fragment structures which are solved to research their functions. In Figure 2, we analyzed all RNAs global structures similarity by PCA, and found that they gathered in space. In Figure 3, we mapped RR3DD to Rfam. It showed that the classification result of Rfam is different with the classification result of RR3DD. In Figure 4, we aligned the structures that have not been classfied to the cluster 16(the cluster includes all tRNAs with similar structure) to the structures in cluster 16, and found that they are dissimilar to tRNAs structure because they underwent conformation change.

Figure 1. The distribution of the number of the members in clusters. The clusters with the number of member less than 10 are not shown.

Figure 2. The principal components analysis of the similarity matrix. The different color points except black point represent different clusters in RR3DD. RNAs in the same class are closed to each other.

Figure 3. The comparing of RR3DD and Rfam. The clusters of RNA in RR3DD are mapped to family ID in Rfam. The horizontal axis represents the cluster. The vertical axis represents the number of the structures belonging to different families of Rfam. Different colors boxes represent the different Rfam families. The figure shows the effect of sequence, secondary and 3D structure on RNA classification.

Figure 4. The boxplot of the tRNAs not in cluster-16. All tRNAs, which are not in cluster-16, are aligned to all the tRNAs of cluster-16. The vertical line (RMscore = 0.45) is the cutoff of the clustering. The structure not in cluster-16 have intrinsically disorder regions, the structure dissimilar with tRNAs in cluster-16.